
Portal:Mathematics
The Mathematics Portal

Mathematics is the study of representing and reasoning about abstract objects (such as numbers, points, spaces, sets, structures, and games). Mathematics is used throughout the world as an essential tool in many fields, including natural science, engineering, medicine, and the social sciences. Applied mathematics, the branch of mathematics concerned with application of mathematical knowledge to other fields, inspires and makes use of new mathematical discoveries and sometimes leads to the development of entirely new mathematical disciplines, such as statistics and game theory. Mathematicians also engage in pure mathematics, or mathematics for its own sake, without having any application in mind. There is no clear line separating pure and applied mathematics, and practical applications for what began as pure mathematics are often discovered. (Full article...)
Featured articles –
-


The weighing pans of this balance scale contain zero objects, divided into two equal groups.
In mathematics, zero is an even number. In other words, its parity—the quality of an integer being even or odd—is even. This can be easily verified based on the definition of "even": it is an integer multiple of 2, specifically 0 × 2. As a result, zero shares all the properties that characterize even numbers: for example, 0 is neighbored on both sides by odd numbers, any decimal integer has the same parity as its last digit—so, since 10 is even, 0 will be even, and if y is even then y + x has the same parity as x—indeed, 0 + x and x always have the same parity.
Zero also fits into the patterns formed by other even numbers. The parity rules of arithmetic, such as even − even = even, require 0 to be even. Zero is the additive identity element of the group of even integers, and it is the starting case from which other even natural numbers are recursively defined. Applications of this recursion from graph theory to computational geometry rely on zero being even. Not only is 0 divisible by 2, it is divisible by every power of 2, which is relevant to the binary numeral system used by computers. In this sense, 0 is the "most even" number of all. (Full article...) -
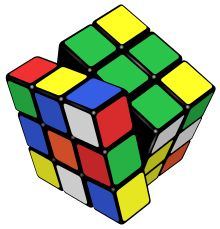
The manipulations of the Rubik's Cube form the Rubik's Cube group.
In mathematics, a group is a set with an operation that satisfies the following constraints: the operation is associative and has an identity element, and every element of the set has an inverse element.
Many mathematical structures are groups endowed with other properties. For example, the integers with the addition operation form an infinite group, which is generated by a single element called (these properties characterize the integers in a unique way). (Full article...) -

High-precision test of general relativity by the Cassini space probe (artist's impression): radio signals sent between the Earth and the probe (green wave) are delayed by the warping of spacetime (blue lines) due to the Sun's mass.
General relativity is a theory of gravitation developed by Albert Einstein between 1907 and 1915. The theory of general relativity says that the observed gravitational effect between masses results from their warping of spacetime.
By the beginning of the 20th century, Newton's law of universal gravitation had been accepted for more than two hundred years as a valid description of the gravitational force between masses. In Newton's model, gravity is the result of an attractive force between massive objects. Although even Newton was troubled by the unknown nature of that force, the basic framework was extremely successful at describing motion. (Full article...) -
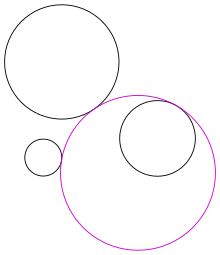
Figure 1: A solution (in purple) to Apollonius's problem. The given circles are shown in black.
In Euclidean plane geometry, Apollonius's problem is to construct circles that are tangent to three given circles in a plane (Figure 1). Apollonius of Perga (c. 262 BC – c. 190 BC) posed and solved this famous problem in his work Ἐπαφαί (Epaphaí, "Tangencies"); this work has been lost, but a 4th-century AD report of his results by Pappus of Alexandria has survived. Three given circles generically have eight different circles that are tangent to them (Figure 2), a pair of solutions for each way to divide the three given circles in two subsets (there are 4 ways to divide a set of cardinality 3 in 2 parts).
In the 16th century, Adriaan van Roomen solved the problem using intersecting hyperbolas, but this solution does not use only straightedge and compass constructions. François Viète found such a solution by exploiting limiting cases: any of the three given circles can be shrunk to zero radius (a point) or expanded to infinite radius (a line). Viète's approach, which uses simpler limiting cases to solve more complicated ones, is considered a plausible reconstruction of Apollonius' method. The method of van Roomen was simplified by Isaac Newton, who showed that Apollonius' problem is equivalent to finding a position from the differences of its distances to three known points. This has applications in navigation and positioning systems such as LORAN. (Full article...) -
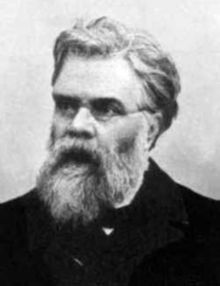
Émile Michel Hyacinthe Lemoine (French: [emil ləmwan]; 22 November 1840 – 21 February 1912) was a French civil engineer and a mathematician, a geometer in particular. He was educated at a variety of institutions, including the Prytanée National Militaire and, most notably, the École Polytechnique. Lemoine taught as a private tutor for a short period after his graduation from the latter school.
Lemoine is best known for his proof of the existence of the Lemoine point (or the symmedian point) of a triangle. Other mathematical work includes a system he called Géométrographie and a method which related algebraic expressions to geometric objects. He has been called a co-founder of modern triangle geometry, as many of its characteristics are present in his work. (Full article...) -
Zhang Heng (Chinese: 張衡; AD 78–139), formerly romanized Chang Heng, was a Chinese polymathic scientist and statesman who lived during the Han dynasty. Educated in the capital cities of Luoyang and Chang'an, he achieved success as an astronomer, mathematician, seismologist, hydraulic engineer, inventor, geographer, cartographer, ethnographer, artist, poet, philosopher, politician, and literary scholar.
Zhang Heng began his career as a minor civil servant in Nanyang. Eventually, he became Chief Astronomer, Prefect of the Majors for Official Carriages, and then Palace Attendant at the imperial court. His uncompromising stance on historical and calendrical issues led to his becoming a controversial figure, preventing him from rising to the status of Grand Historian. His political rivalry with the palace eunuchs during the reign of Emperor Shun (r. 125–144) led to his decision to retire from the central court to serve as an administrator of Hejian Kingdom in present-day Hebei. Zhang returned home to Nanyang for a short time, before being recalled to serve in the capital once more in 138. He died there a year later, in 139. (Full article...) -

Stylistic impression of the number, representing how its decimals go on infinitely
In mathematics, 0.999... (also written as 0.9, 0. or 0.(9)) is a notation for the repeating decimal consisting of an unending sequence of 9s after the decimal point. This repeating decimal is a numeral that represents the smallest number no less than every number in the sequence ; that is, the supremum of this sequence. This number is equal to 1. In other words, "0.999..." is not "almost exactly 1" or "very, very nearly but not quite 1"; rather, "0.999..." and "1" represent exactly the same number.
There are many ways of showing this equality, from intuitive arguments to mathematically rigorous proofs. The technique used depends on the target audience, background assumptions, historical context, and preferred development of the real numbers, the system within which 0.999... is commonly defined. In other systems, 0.999... can have the same meaning, a different definition, or be undefined. (Full article...) -
Leonhard Euler (/ˈɔɪlər/ OY-lər, German: [ˈleːɔnhaʁt ˈʔɔʏlɐ] ⓘ, Swiss Standard German: [ˈleːɔnhart ˈɔʏlər]; 15 April 1707 – 18 September 1783) was a Swiss mathematician, physicist, astronomer, geographer, logician, and engineer who founded the studies of graph theory and topology and made pioneering and influential discoveries in many other branches of mathematics such as analytic number theory, complex analysis, and infinitesimal calculus. He introduced much of modern mathematical terminology and notation, including the notion of a mathematical function. He is also known for his work in mechanics, fluid dynamics, optics, astronomy, and music theory.
Euler is held to be one of the greatest mathematicians in history and the greatest of the 18th century. Several great mathematicians who produced their work after Euler's death have recognised his importance in the field as shown by quotes attributed to many of them: Pierre-Simon Laplace expressed Euler's influence on mathematics by stating, "Read Euler, read Euler, he is the master of us all." Carl Friedrich Gauss wrote: "The study of Euler's works will remain the best school for the different fields of mathematics, and nothing else can replace it." Euler is also widely considered to be the most prolific; his 866 publications as well as his correspondences are being collected in the Opera Omnia Leonhard Euler which, when completed, will consist of 81 quarto volumes. He spent most of his adult life in Saint Petersburg, Russia, and in Berlin, then the capital of Prussia. (Full article...) -

Euclid's method for finding the greatest common divisor (GCD) of two starting lengths BA and DC, both defined to be multiples of a common "unit" length. The length DC being shorter, it is used to "measure" BA, but only once because the remainder EA is less than DC. EA now measures (twice) the shorter length DC, with remainder FC shorter than EA. Then FC measures (three times) length EA. Because there is no remainder, the process ends with FC being the GCD. On the right Nicomachus's example with numbers 49 and 21 resulting in their GCD of 7 (derived from Heath 1908:300).
In mathematics, the Euclidean algorithm, or Euclid's algorithm, is an efficient method for computing the greatest common divisor (GCD) of two integers (numbers), the largest number that divides them both without a remainder. It is named after the ancient Greek mathematician Euclid, who first described it in his Elements (c. 300 BC).
It is an example of an algorithm, a step-by-step procedure for performing a calculation according to well-defined rules,
and is one of the oldest algorithms in common use. It can be used to reduce fractions to their simplest form, and is a part of many other number-theoretic and cryptographic calculations.
The Euclidean algorithm is based on the principle that the greatest common divisor of two numbers does not change if the larger number is replaced by its difference with the smaller number. For example, 21 is the GCD of 252 and 105 (as 252 = 21 × 12 and 105 = 21 × 5), and the same number 21 is also the GCD of 105 and 252 − 105 = 147. Since this replacement reduces the larger of the two numbers, repeating this process gives successively smaller pairs of numbers until the two numbers become equal. When that occurs, they are the GCD of the original two numbers. By reversing the steps or using the extended Euclidean algorithm, the GCD can be expressed as a linear combination of the two original numbers, that is the sum of the two numbers, each multiplied by an integer (for example, 21 = 5 × 10⁵ + (−2) × 252). The fact that the GCD can always be expressed in this way is known as Bézout's identity. (Full article...) -
Amalie Emmy Noether (US: /ˈnʌtər/, UK: /ˈnɜːtə/; German: [ˈnøːtɐ]; 23 March 1882 – 14 April 1935) was a German mathematician who made many important contributions to abstract algebra. She proved Noether's first and second theorems, which are fundamental in mathematical physics. She was described by Pavel Alexandrov, Albert Einstein, Jean Dieudonné, Hermann Weyl and Norbert Wiener as the most important woman in the history of mathematics. As one of the leading mathematicians of her time, she developed theories of rings, fields, and algebras. In physics, Noether's theorem explains the connection between symmetry and conservation laws.
Noether was born to a Jewish family in the Franconian town of Erlangen; her father was the mathematician Max Noether. She originally planned to teach French and English after passing the required examinations but instead studied mathematics at the University of Erlangen, where her father lectured. After completing her doctorate in 1907 under the supervision of Paul Gordan, she worked at the Mathematical Institute of Erlangen without pay for seven years. At the time, women were largely excluded from academic positions. In 1915, she was invited by David Hilbert and Felix Klein to join the mathematics department at the University of Göttingen, a world-renowned center of mathematical research. The philosophical faculty objected, however, and she spent four years lecturing under Hilbert's name. Her habilitation was approved in 1919, allowing her to obtain the rank of Privatdozent. (Full article...) -

Plots of logarithm functions, with three commonly used bases. The special points logb b = 1 are indicated by dotted lines, and all curves intersect in logb 1 = 0.
In mathematics, the logarithm is the inverse function to exponentiation. That means that the logarithm of a number x to the base b is the exponent to which b must be raised to produce x. For example, since 1000 = 103, the logarithm base of 1000 is 3, or log10 (1000) = 3. The logarithm of x to base b is denoted as logb (x), or without parentheses, logb x. When the base is clear from the context or is irrelevant, such as in big O notation, it is sometimes written log x.
The logarithm base 10 is called the decimal or common logarithm and is commonly used in science and engineering. The natural logarithm has the number e ≈ 2.718 as its base; its use is widespread in mathematics and physics, because of its very simple derivative. The binary logarithm uses base 2 and is frequently used in computer science. (Full article...) -

Richard Phillips Feynman (/ˈfaɪnmən/; May 11, 1918 – February 15, 1988) was an American theoretical physicist, known for his work in the path integral formulation of quantum mechanics, the theory of quantum electrodynamics, the physics of the superfluidity of supercooled liquid helium, as well as his work in particle physics for which he proposed the parton model. For his contributions to the development of quantum electrodynamics, Feynman received the Nobel Prize in Physics in 1965 jointly with Julian Schwinger and Shin'ichirō Tomonaga.
Feynman developed a widely used pictorial representation scheme for the mathematical expressions describing the behavior of subatomic particles, which later became known as Feynman diagrams. During his lifetime, Feynman became one of the best-known scientists in the world. In a 1999 poll of 130 leading physicists worldwide by the British journal Physics World, he was ranked the seventh-greatest physicist of all time. (Full article...) -
Edward Wright (baptised 8 October 1561; died November 1615) was an English mathematician and cartographer noted for his book Certaine Errors in Navigation (1599; 2nd ed., 1610), which for the first time explained the mathematical basis of the Mercator projection by building on the works of Pedro Nunes, and set out a reference table giving the linear scale multiplication factor as a function of latitude, calculated for each minute of arc up to a latitude of 75°. This was in fact a table of values of the integral of the secant function, and was the essential step needed to make practical both the making and the navigational use of Mercator charts.
Wright was born at Garveston in Norfolk and educated at Gonville and Caius College, Cambridge, where he became a fellow from 1587 to 1596. In 1589 the college granted him leave after Elizabeth I requested that he carry out navigational studies with a raiding expedition organised by the Earl of Cumberland to the Azores to capture Spanish galleons. The expedition's route was the subject of the first map to be prepared according to Wright's projection, which was published in Certaine Errors in 1599. The same year, Wright created and published the first world map produced in England and the first to use the Mercator projection since Gerardus Mercator's original 1569 map. (Full article...) -
Archimedes of Syracuse (/ˌɑːrkɪˈmiːdiːz/ AR-kim-EE-deez; c. 287 – c. 212 BC) was an Ancient Greek mathematician, physicist, engineer, astronomer, and inventor from the ancient city of Syracuse in Sicily. Although few details of his life are known, he is regarded as one of the leading scientists in classical antiquity. Considered the greatest mathematician of ancient history, and one of the greatest of all time, Archimedes anticipated modern calculus and analysis by applying the concept of the infinitely small and the method of exhaustion to derive and rigorously prove a range of geometrical theorems. These include the area of a circle, the surface area and volume of a sphere, the area of an ellipse, the area under a parabola, the volume of a segment of a paraboloid of revolution, the volume of a segment of a hyperboloid of revolution, and the area of a spiral.
Archimedes' other mathematical achievements include deriving an approximation of pi, defining and investigating the Archimedean spiral, and devising a system using exponentiation for expressing very large numbers. He was also one of the first to apply mathematics to physical phenomena, working on statics and hydrostatics. Archimedes' achievements in this area include a proof of the law of the lever, the widespread use of the concept of center of gravity, and the enunciation of the law of buoyancy known as Archimedes' principle. He is also credited with designing innovative machines, such as his screw pump, compound pulleys, and defensive war machines to protect his native Syracuse from invasion. (Full article...) -
Johannes Kepler (/ˈkɛplər/; German: [joˈhanəs ˈkɛplɐ, -nɛs -] ⓘ; 27 December 1571 – 15 November 1630) was a German astronomer, mathematician, astrologer, natural philosopher and writer on music. He is a key figure in the 17th-century Scientific Revolution, best known for his laws of planetary motion, and his books Astronomia nova, Harmonice Mundi, and Epitome Astronomiae Copernicanae, influencing among others Isaac Newton, providing one of the foundations for his theory of universal gravitation. The variety and impact of his work made Kepler one of the founders and fathers of modern astronomy, the scientific method, natural and modern science. He has been described as the "father of science fiction" for his novel Somnium.
Kepler was a mathematics teacher at a seminary school in Graz, where he became an associate of Prince Hans Ulrich von Eggenberg. Later he became an assistant to the astronomer Tycho Brahe in Prague, and eventually the imperial mathematician to Emperor Rudolf II and his two successors Matthias and Ferdinand II. He also taught mathematics in Linz, and was an adviser to General Wallenstein.
Additionally, he did fundamental work in the field of optics, being named the father of modern optics, in particular for his Astronomiae pars optica. He also invented an improved version of the refracting telescope, the Keplerian telescope, which became the foundation of the modern refracting telescope, while also improving on the telescope design by Galileo Galilei, who mentioned Kepler's discoveries in his work. (Full article...)


Selected image –

Good articles –
-
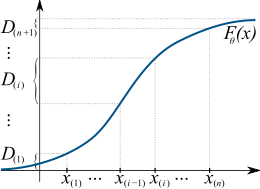
The maximum spacing method tries to find a distribution function such that the spacings, D(i), are all approximately of the same length. This is done by maximizing their geometric mean.
In statistics, maximum spacing estimation (MSE or MSP), or maximum product of spacing estimation (MPS), is a method for estimating the parameters of a univariate statistical model. The method requires maximization of the geometric mean of spacings in the data, which are the differences between the values of the cumulative distribution function at neighbouring data points.
The concept underlying the method is based on the probability integral transform, in that a set of independent random samples derived from any random variable should on average be uniformly distributed with respect to the cumulative distribution function of the random variable. The MPS method chooses the parameter values that make the observed data as uniform as possible, according to a specific quantitative measure of uniformity. (Full article...) -

Fibonacci nim is played with a pile of coins. The number of coins in this pile, 21, is a Fibonacci number, so a game starting with this pile and played optimally will be won by the second player.
Fibonacci nim is a mathematical subtraction game, a variant of the game of nim. Players alternate removing coins from a pile, on each move taking at most twice as many coins as the previous move, and winning by taking the last coin. The Fibonacci numbers feature heavily in its analysis; in particular, the first player can win if and only if the starting number of coins is not a Fibonacci number. A complete strategy is known for best play in games with a single pile of counters, but not for variants of the game with multiple piles. (Full article...) -

Natural patterns form as wind blows sand in the dunes of the Namib Desert. The crescent shaped dunes and the ripples on their surfaces repeat wherever there are suitable conditions.
Patterns in nature are visible regularities of form found in the natural world. These patterns recur in different contexts and can sometimes be modelled mathematically. Natural patterns include symmetries, trees, spirals, meanders, waves, foams, tessellations, cracks and stripes. Early Greek philosophers studied pattern, with Plato, Pythagoras and Empedocles attempting to explain order in nature. The modern understanding of visible patterns developed gradually over time.
In the 19th century, the Belgian physicist Joseph Plateau examined soap films, leading him to formulate the concept of a minimal surface. The German biologist and artist Ernst Haeckel painted hundreds of marine organisms to emphasise their symmetry. Scottish biologist D'Arcy Thompson pioneered the study of growth patterns in both plants and animals, showing that simple equations could explain spiral growth. In the 20th century, the British mathematician Alan Turing predicted mechanisms of morphogenesis which give rise to patterns of spots and stripes. The Hungarian biologist Aristid Lindenmayer and the French American mathematician Benoît Mandelbrot showed how the mathematics of fractals could create plant growth patterns. (Full article...) -

Squaring the circle: the areas of this square and this circle are both equal to π. In 1882, it was proven that this figure cannot be constructed in a finite number of steps with an idealized compass and straightedge.
Squaring the circle is a problem in geometry first proposed in Greek mathematics. It is the challenge of constructing a square with the area of a given circle by using only a finite number of steps with a compass and straightedge. The difficulty of the problem raised the question of whether specified axioms of Euclidean geometry concerning the existence of lines and circles implied the existence of such a square.
In 1882, the task was proven to be impossible, as a consequence of the Lindemann–Weierstrass theorem, which proves that pi () is a transcendental number.
That is, is not the root of any polynomial with rational coefficients. It had been known for decades that the construction would be impossible if were transcendental, but that fact was not proven until 1882. Approximate constructions with any given non-perfect accuracy exist, and many such constructions have been found. (Full article...) -
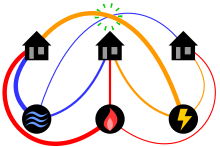
Diagram of the three utilities problem showing lines in a plane. Can each house be connected to each utility, with no connection lines crossing?
The classical mathematical puzzle known as the three utilities problem or sometimes water, gas and electricity asks for non-crossing connections to be drawn between three houses and three utility companies in the plane. When posing it in the early 20th century, Henry Dudeney wrote that it was already an old problem. It is an impossible puzzle: it is not possible to connect all nine lines without crossing. Versions of the problem on nonplanar surfaces such as a torus or Möbius strip, or that allow connections to pass through other houses or utilities, can be solved.
This puzzle can be formalized as a problem in topological graph theory by asking whether the complete bipartite graph , with vertices representing the houses and utilities and edges representing their connections, has a graph embedding in the plane. The impossibility of the puzzle corresponds to the fact that is not a planar graph. Multiple proofs of this impossibility are known, and form part of the proof of Kuratowski's theorem characterizing planar graphs by two forbidden subgraphs, one of which is . The question of minimizing the number of crossings in drawings of complete bipartite graphs is known as Turán's brick factory problem, and for the minimum number of crossings is one. (Full article...) -
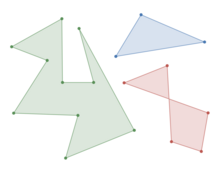
Two simple polygons (green and blue) and a self-intersecting polygon (red, in the lower right, not simple)
In geometry, a simple polygon is a polygon that does not intersect itself and has no holes. That is, it is a piecewise-linear Jordan curve consisting of finitely many line segments. These polygons include as special cases the convex polygons, star-shaped polygons, and monotone polygons.
The sum of external angles of a simple polygon is . Every simple polygon with sides can be triangulated by of its diagonals, and by the art gallery theorem its interior is visible from some of its vertices. (Full article...) -
Stars is a wood engraving print created by the Dutch artist M. C. Escher in 1948, depicting two chameleons in a polyhedral cage floating through space.
The compound of three octahedra used for the central cage in Stars had been studied before in mathematics, and Escher likely learned of it from the book Vielecke und Vielflache by Max Brückner. Escher used similar compound polyhedral forms in several other works, including Crystal (1947), Study for Stars (1948), Double Planetoid (1949), and Waterfall (1961). (Full article...) -
In geometry, an isosceles triangle (/aɪˈsɒsəliːz/) is a triangle that has two sides of equal length. Sometimes it is specified as having exactly two sides of equal length, and sometimes as having at least two sides of equal length, the latter version thus including the equilateral triangle as a special case.
Examples of isosceles triangles include the isosceles right triangle, the golden triangle, and the faces of bipyramids and certain Catalan solids.
The mathematical study of isosceles triangles dates back to ancient Egyptian mathematics and Babylonian mathematics. Isosceles triangles have been used as decoration from even earlier times, and appear frequently in architecture and design, for instance in the pediments and gables of buildings. (Full article...) -

In mathematics, the Pythagorean theorem or Pythagoras' theorem is a fundamental relation in Euclidean geometry between the three sides of a right triangle. It states that the area of the square whose side is the hypotenuse (the side opposite the right angle) is equal to the sum of the areas of the squares on the other two sides.
The theorem can be written as an equation relating the lengths of the sides a, b and the hypotenuse c, sometimes called the Pythagorean equation:
:
The theorem is named for the Greek philosopher Pythagoras, born around 570 BC. The theorem has been proved numerous times by many different methods – possibly the most for any mathematical theorem. The proofs are diverse, including both geometric proofs and algebraic proofs, with some dating back thousands of years. (Full article...) -

A convex curve (black) forms a connected subset of the boundary of a convex set (blue), and has a supporting line (red) through each of its points.
In geometry, a convex curve is a plane curve that has a supporting line through each of its points. There are many other equivalent definitions of these curves, going back to Archimedes. Examples of convex curves include the convex polygons, the boundaries of convex sets, and the graphs of convex functions. Important subclasses of convex curves include the closed convex curves (the boundaries of bounded convex sets), the smooth curves that are convex, and the strictly convex curves, which have the additional property that each supporting line passes through a unique point of the curve.
Bounded convex curves have a well-defined length, which can be obtained by approximating them with polygons, or from the average length of their projections onto a line. The maximum number of grid points that can belong to a single curve is controlled by its length. The points at which a convex curve has a unique supporting line are dense within the curve, and the distance of these lines from the origin defines a continuous support function. A smooth simple closed curve is convex if and only if its curvature has a consistent sign, which happens if and only if its total curvature equals its total absolute curvature. (Full article...) -

A Pythagorean tiling
A Pythagorean tiling or two squares tessellation is a tiling of a Euclidean plane by squares of two different sizes, in which each square touches four squares of the other size on its four sides. Many proofs of the Pythagorean theorem are based on it, explaining its name. It is commonly used as a pattern for floor tiles. When used for this, it is also known as a hopscotch pattern or pinwheel pattern,
but it should not be confused with the mathematical pinwheel tiling, an unrelated pattern.
This tiling has four-way rotational symmetry around each of its squares. When the ratio of the side lengths of the two squares is an irrational number such as the golden ratio, its cross-sections form aperiodic sequences with a similar recursive structure to the Fibonacci word. Generalizations of this tiling to three dimensions have also been studied. (Full article...) -

Measuring the width of a Reuleaux triangle as the distance between parallel supporting lines. Because this distance does not depend on the direction of the lines, the Reuleaux triangle is a curve of constant width.
In geometry, a curve of constant width is a simple closed curve in the plane whose width (the distance between parallel supporting lines) is the same in all directions. The shape bounded by a curve of constant width is a body of constant width or an orbiform, the name given to these shapes by Leonhard Euler. Standard examples are the circle and the Reuleaux triangle. These curves can also be constructed using circular arcs centered at crossings of an arrangement of lines, as the involutes of certain curves, or by intersecting circles centered on a partial curve.
Every body of constant width is a convex set, its boundary crossed at most twice by any line, and if the line crosses perpendicularly it does so at both crossings, separated by the width. By Barbier's theorem, the body's perimeter is exactly π times its width, but its area depends on its shape, with the Reuleaux triangle having the smallest possible area for its width and the circle the largest. Every superset of a body of constant width includes pairs of points that are farther apart than the width, and every curve of constant width includes at least six points of extreme curvature. Although the Reuleaux triangle is not smooth, curves of constant width can always be approximated arbitrarily closely by smooth curves of the same constant width. (Full article...)


Did you know (auto-generated) –

- ... that ten-sided gaming dice have kite-shaped faces?
- ... that the discovery of Descartes' theorem in geometry came from a too-difficult mathematics problem posed to a princess?
- ... that despite published scholarship to the contrary, Andrew Planta neither received a doctorate nor taught mathematics at Erlangen?
- ... that circle packings in the form of a Doyle spiral were used to model plant growth long before their mathematical investigation by Doyle?
- ... that after Archimedes first defined convex curves, mathematicians lost interest in their analysis until the 19th century, more than two millennia later?
- ... that owner Matthew Benham influenced both Brentford FC in the UK and FC Midtjylland in Denmark to use mathematical modelling to recruit undervalued football players?
- ... that record-setting airplane spinner Catherine Cavagnaro is also a professional mathematician?
- ... that Donn Piatt threw his mathematics teacher out of the window?
More did you know –
- … that the Riemann Hypothesis, one of the Millennium Problems, depends on the asymptotic growth of the Mertens Function?
- … that every positive integer can be written as the sum of three palindromic numbers in every number system with base 5 or greater?
- … that the best known lower bound for the length of the smallest superpermutation was first posted anonymously to the internet imageboard 4chan?
- ...that the mathematician Grigori Perelman was offered a Fields Medal in 2006, in part for his proof of the Poincaré conjecture, which he declined?
- ...that a regular heptagon is the regular polygon with the fewest sides which is not constructible with a compass and straightedge?
- ...that the regular trigonometric functions and the hyperbolic trigonometric functions can be related without using complex numbers through the Gudermannian function?
- ...that the Catalan numbers solve a number of problems in combinatorics such as the number of ways to completely parenthesize an algebraic expression with n+1 factors?
Selected article –
 |
| 3D illustration of a stereographic projection from the north pole onto a plane below the sphere. Image credit: Mark Howison |
In geometry, the stereographic projection is a particular mapping (function) that projects a sphere onto a plane. The projection is defined on the entire sphere, except at one point: the projection point. Where it is defined, the mapping is smooth and bijective. It is conformal, meaning that it preserves angles. It is neither isometric nor area-preserving: that is, it preserves neither distances nor the areas of figures.
Intuitively, then, the stereographic projection is a way of picturing the sphere as the plane, with some inevitable compromises. Because the sphere and the plane appear in many areas of mathematics and its applications, so does the stereographic projection; it finds use in diverse fields including complex analysis, cartography, geology, and photography. (Full article...)
| View all selected articles |
Subcategories

Algebra | Arithmetic | Analysis | Complex analysis | Applied mathematics | Calculus | Category theory | Chaos theory | Combinatorics | Dynamical systems | Fractals | Game theory | Geometry | Algebraic geometry | Graph theory | Group theory | Linear algebra | Mathematical logic | Model theory | Multi-dimensional geometry | Number theory | Numerical analysis | Optimization | Order theory | Probability and statistics | Set theory | Statistics | Topology | Algebraic topology | Trigonometry | Linear programming
Mathematics | History of mathematics | Mathematicians | Awards | Education | Literature | Notation | Organizations | Theorems | Proofs | Unsolved problems
Topics in mathematics
| General | Foundations | Number theory | Discrete mathematics |
|---|---|---|---|
| |||
| Algebra | Analysis | Geometry and topology | Applied mathematics |
Index of mathematics articles
| ARTICLE INDEX: | |
| MATHEMATICIANS: |
Related portals
WikiProjects
![]() The Mathematics WikiProject is the center for mathematics-related editing on Wikipedia. Join the discussion on the project's talk page.
The Mathematics WikiProject is the center for mathematics-related editing on Wikipedia. Join the discussion on the project's talk page.
|
Project pages Essays Subprojects Related projects
|
Things you can do
|
In other Wikimedia projects
The following Wikimedia Foundation sister projects provide more on this subject:
-
 Commons
Free media repository -
 Wikibooks
Free textbooks and manuals -
 Wikidata
Free knowledge base -
 Wikinews
Free-content news -
 Wikiquote
Collection of quotations -
 Wikisource
Free-content library -
 Wikiversity
Free learning tools -
 Wiktionary
Dictionary and thesaurus


